[Movie produced by Laure Gaillard]
 |
Click image to see this GIF movie comparing the first mode from the nonlinear
principal component analysis (NLPCA) and that from the principal
component analysis (PCA) of the tropical Pacific sea
surface temperature (SST) anomalies. As the nonlinear
principal component (NLPC) or the principal component (PC)
swings from one extreme to the other, the climate system goes
from extreme La Niña to extreme El Niño.
(The movie loops continuously, but pauses for
a few seconds at the extreme La Niña and El
Niño states).
The PCA first mode shows La Niña to be anti-symmetrical to El
Niño (but with a weaker magnitude), i.e. the PCA
mode is a standing wave. The NLPCA was used to extract the nonlinear relation
among the 7 leading PCs. The first NLPCA mode
shows the La Niña cool SST anomalies to be located
further west, and the El Niño warm SST anomalies to
be more intense and located further east than those in the first
PCA mode. The NLPCA solution agrees much better
with the observations. (For details, see
Hsieh, 2007)
(preprint). [This movie is also
available in
AVI format]. [Movie produced by Laure Gaillard] |
 |
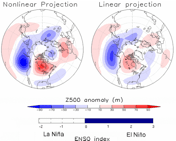
Click image to see this animated GIF movie comparing the nonlinear
and linear projection (i.e. regression) of the El
Niño-Southern Oscillation (ENSO) index to the 500
mb geopotential height (Z500) anomaly of the Northern
Hemisphere winter, i.e. the movie shows the anomalies in
the Z500 field associated with changes in the ENSO index
as it swings from one extreme (La Niña,
corresponding to cold conditions in the tropical Pacific)
to the other extreme (El Niño, warm
conditions). The linear projection gives a
standing wave response in the Z500 anomaly field as the
ENSO index varies, while in the nonlinear projection, the
response is not spatially fixed. The presence of
substantial response over the Euro-Atlantic region, in the
form of a positive "North Atlantic Oscillation" (NAO)
pattern (during both extreme La Niña and El
Niño) in the nonlinear projection is missing in the
linear projection. This shows that there is a nonlinear
excitation of the positive NAO pattern by ENSO. (For
more details on nonlinear atmospheric teleconnections, see
Hsieh et al. 2006). [This movie is
also available in AVI format]. [Movie produced by Clément Suavet] |
 |
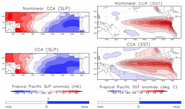
Click image to see this GIF movie comparing the first mode from the nonlinear
canonical correlation analysis (NLCCA) and that from the canonical
correlation analysis (CCA) of the tropical Pacific sea level pressure
(SLP) and sea surface temperature (SST) anomalies. Both methods try to
find the strongest correlated patterns between the SLP and
the SST anomaly fields. In the movie, the SLP
anomalies are shown in the left column and the SST anomalies in the
right column, with the NLCCA mode on top of the CCA mode. As the
canonical variates u and v swing from one extreme to the other, the
climate system goes from extreme La Niña to extreme El
Niño. The CCA first mode shows La Niña to be
anti-symmetrical to El Niño (but with a weaker magnitude). The
NLCCA first mode shows both the SLP and SST anomalies to be located
further west during La Niña, and the SLP and SST anomalies to be
concentrated further east during El Niño than those in the first CCA
mode. (For details, see Hsieh 2001b, or Hsieh, 2004).
[This movie is also available in
AVI format]. [Movie produced by Clément Suavet] |
References:
Hsieh, W.W., 2001. Nonlinear canonical correlation
analysis of the tropical Pacific climate variability using a neural
network approach. J. Climate, 14: 2528-2539. (reprint in PDF)
Hsieh, W.W., 2004. Nonlinear multivariate and time series analysis by
neural network methods. Reviews of Geophysics, 42, RG1003,
doi:10.1029/2002RG000112. (reprint in PDF)
Hsieh, W.W., 2007. Nonlinear principal component analysis of
noisy data. Neural Networks, 20: 434-443. DOI: 10.1016/j.neunet.2007.04.018
Neural Networks, 20: 434-443. DOI: 10.1016/j.neunet.2007.04.018)
(preprint in PDF)
Hsieh, W.W., A. Wu and A. Shabbar, 2006. Nonlinear atmospheric teleconnections. Geophys. Res. Lett. 33, L07714, doi:10.1029/2005GL025471. (preprint in PDF) (Videos).